 VISR
Performance benchmarks
We try to make these comparisons fair, but numbers or projects may be wrong or out of date. Corrections? Updates? A new port or build we should add? Open an issue
Last measured: 2026-11-06.
The results spreadsheet holds every number. The methodology is at the bottom of this page.
Mac
Measured on a Mac mini M6 with the matched-stock settings and a 2560×1920 drawable, the frame cap and vsync off. Bars show median CPU time and median GPU time per frame in milliseconds, CPU above GPU for each build. Lower is better. A build that reports only one of the two is drawn with that bar alone; builds that report neither are listed as not reported. A build with no uncapped run is drawn from its run tied to the display's refresh rate, with the display rate and its settings named in the table. The FPS view shows average fps.
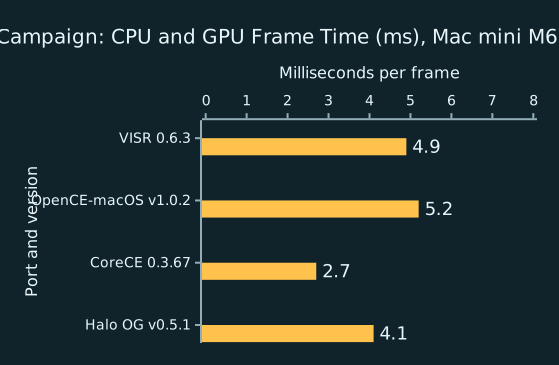
Median CPU time Median GPU time
Lower is better.
| Build | Measured | Median CPU time (ms) | Median GPU time (ms) | 90th-percentile GPU time (ms) | Notes |
|---|---|---|---|---|---|
| VISR 0.6.11 | 2026-11-06 | 2.07 | 2.6 | 3 | |
| OpenCE-macOS v1.0.2 | 2026-10-28 | – | 5.17 | 7.57 | |
| CoreCE 0.3.67 | 2026-11-05 | 5.43 | 2.96 | 3.93 | |
| Chupathingy v0.8.1d | 2026-11-04 | 2.5 | 3.21 | 3.76 | OpenGL app, timed at its frame swap |
| Halo OG v0.5.1 | 2026-10-28 | – | 4.1 | 5.9 | Limited by CPU command submission, not by a frame cap |
Mac: frame rate
Measured on a Mac mini M6 with the frame cap and vsync off, the matched-stock settings and a 2560×1920 drawable. Uncapped frame rate in frames per second; a build with no uncapped run has no bar here. Bars show average fps; the table lists median and 90th-percentile GPU time per rendered frame.
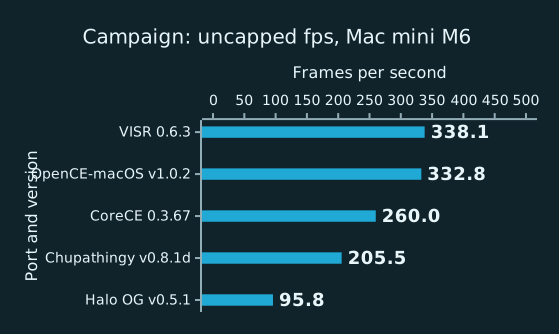
Average fps
Higher is better.
| Build | Measured | Median GPU time (ms) | 90th-percentile GPU time (ms) | Notes |
|---|---|---|---|---|
| VISR 0.6.11 | 2026-11-06 | 2.6 | 3 | |
| OpenCE-macOS v1.0.2 | 2026-10-28 | 5.17 | 7.57 | |
| CoreCE 0.3.67 | 2026-11-05 | 2.96 | 3.93 | |
| Chupathingy v0.8.1d | 2026-11-04 | 3.21 | 3.76 | OpenGL app, timed at its frame swap |
| Halo OG v0.5.1 | 2026-10-28 | 4.1 | 5.9 | Limited by CPU command submission, not by a frame cap |
| OpenH1 build-1683 | 2026-11-06 | – | – | no GPU times reported |
iPhone and iPad
Measured on an iPad Pro M1 from runs presented at the display rate. Bars show median CPU time and median GPU time per frame in milliseconds, CPU above GPU for each build, on an axis that ends at the frame budget at the display rate. Lower is better. A build that reports only one of the two is drawn with that bar alone; builds that report neither are listed as not reported. The FPS view shows average fps with the 1% low fps directly below it.
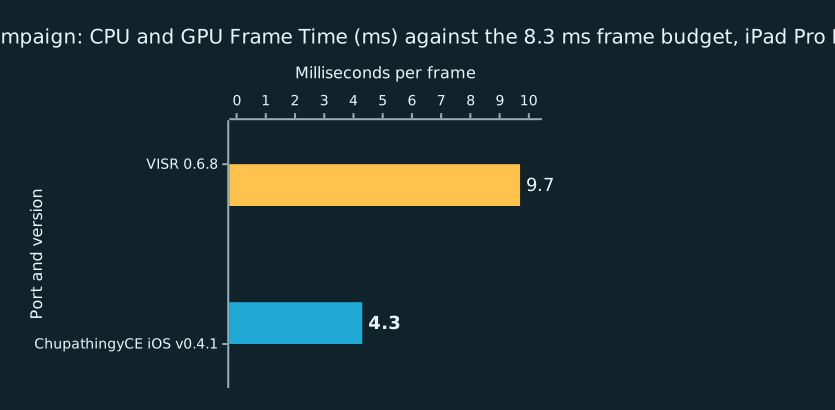
Median CPU time Median GPU time
Lower is better.
| Build | Measured | Median CPU time (ms) | Median GPU time (ms) | 90th-percentile GPU time (ms) | Notes |
|---|---|---|---|---|---|
| VISR 0.6.10 | 2026-11-05 | 3.03 | 6.02 | 6.52 | a10 not measured yet |
| ChupathingyCE iOS v0.4.1 | 2026-11-03 | 4.27 | – | – | a10 not measured yet |
iPhone and iPad: frame rate
Measured on an iPad Pro M1 from runs presented at the display rate. Frame rate in frames per second; a missed frame shows here even when the work per frame above is low. Bars show average fps and 1% low fps (the slowest 1% of frames); the table lists the share of frames that arrive on time, within 5% of the display interval.
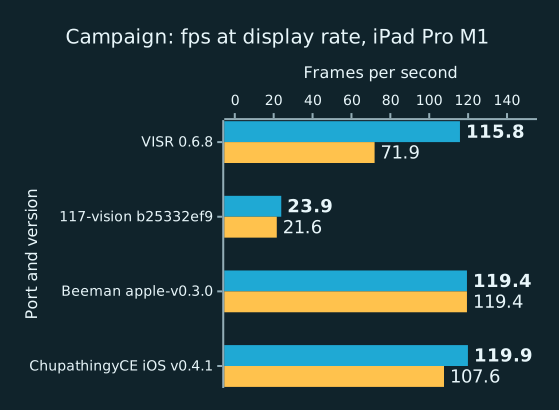
Average fps 1% low fps
Higher is better.
| Build | Measured | On time | Notes |
|---|---|---|---|
| VISR 0.6.10 | 2026-11-05 | 100% | a10 not measured yet |
| 117-vision b25332ef9 | 2026-10-29 | – | no on-time share reported; a10 not measured yet |
| Beeman apple-v0.3.0 | 2026-10-27 | – | no on-time share reported; b30 not measured yet |
| ChupathingyCE iOS v0.4.1 | 2026-11-03 | 95.9% | a10 not measured yet |
Apple TV
Measured on an Apple TV 4K (3rd generation) from runs presented at the frame caps of its profile: 60 fps in play, 30 fps in cutscenes. Bars show median CPU time and median GPU time per frame in milliseconds, CPU above GPU for each build, on an axis that ends at the frame budget at the profile's frame cap. Lower is better. A build that reports only one of the two is drawn with that bar alone; builds that report neither are listed as not reported. The FPS view shows average fps with the 1% low fps directly below it.
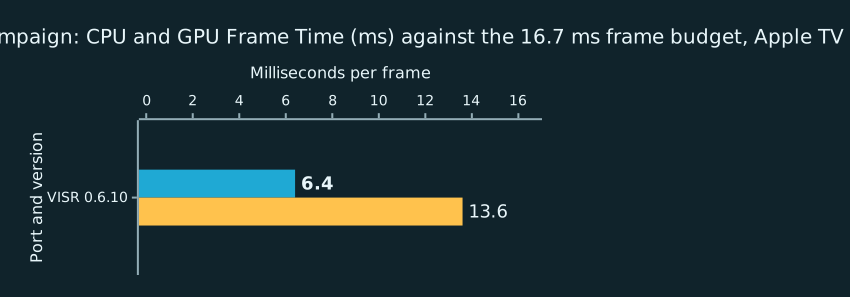
Median CPU time Median GPU time
Lower is better.
| Build | Measured | Median CPU time (ms) | Median GPU time (ms) | 90th-percentile GPU time (ms) | Notes |
|---|---|---|---|---|---|
| VISR 0.6.10 | 2026-11-04 | 6.42 | 13.65 | – | |
| Beeman main e3abbd1 | 2026-11-05 | 8.43 | – | – |
Apple TV: frame rate
Measured on an Apple TV 4K (3rd generation) from runs presented at the frame caps of its profile: 60 fps in play, 30 fps in cutscenes. Frame rate in frames per second; a missed frame shows here even when the work per frame above is low. Bars show average fps and 1% low fps (the slowest 1% of frames); the table lists the share of frames that arrive on time, within 5% of the display interval.
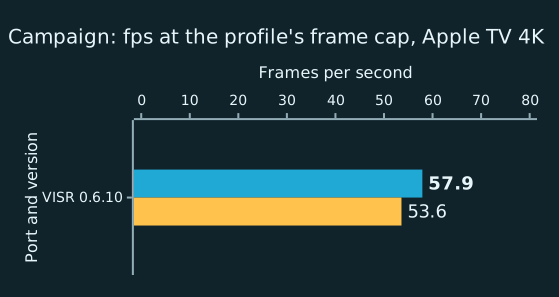
Average fps 1% low fps
Higher is better.
| Build | Measured | On time | Notes |
|---|---|---|---|
| VISR 0.6.10 | 2026-11-04 | 99.9% | |
| Beeman main e3abbd1 | 2026-11-05 | 53.5% |
Vision Pro
Measured on an M2 Vision Pro from runs presented at the display rate. Bars show median CPU time and median GPU time per frame in milliseconds, CPU above GPU for each build, on an axis that ends at the frame budget at the display rate. Lower is better. A build that reports only one of the two is drawn with that bar alone; builds that report neither are listed as not reported. The FPS view shows average fps with the 1% low fps directly below it.
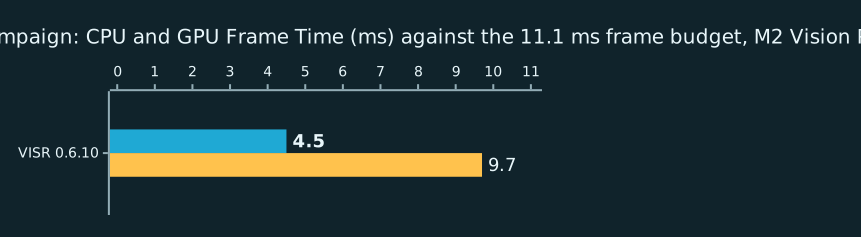
Median CPU time Median GPU time
Lower is better.
| Build | Measured | Median CPU time (ms) | Median GPU time (ms) | 90th-percentile GPU time (ms) | Notes |
|---|---|---|---|---|---|
| VISR 0.6.10 | 2026-11-04 | 4.53 | 9.72 | – | Replays a recorded route |
Vision Pro: frame rate
Measured on an M2 Vision Pro from runs presented at the display rate. Frame rate in frames per second; a missed frame shows here even when the work per frame above is low. Bars show average fps, with the 1% low fps directly below it where the app reports one; the table lists 95th-percentile frame time and the share of frames on time, within 5% of the display interval, where reported.
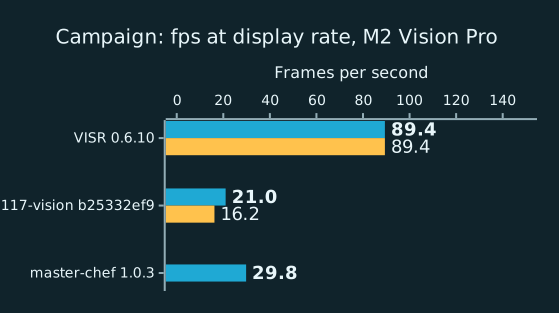
Average fps 1% low fps
Higher is better.
| Build | Measured | 95th-percentile frame time (ms) | On time | Notes |
|---|---|---|---|---|
| VISR 0.6.10 | 2026-11-04 | 11.1 | 99.8% | Replays a recorded route; a10 not measured yet |
| 117-vision b25332ef9 | 2026-10-29 | – | – | no frame times reported; a10 not measured yet |
| master-chef 1.0.3 | 2026-10-27 | – | – | Runs with no input, fixed at 30 fps as shipped; it has no setting to run faster and reports no frame times |
Methodology
The snapshot holds 399 measured windows for 11 ports on 4 platforms (Mac, iPhone/iPad, Apple TV, Vision Pro). Each window's value is the mean over its valid rounds. A bar is the geometric mean of the windows' average presentation rates, drawn beside the geometric mean of their 1% low rates (1000 divided by the 99th percentile interval). When a build was measured on several dates, the newest set is charted. Sets with fewer than three rounds, and targets that could not run, stay in the spreadsheet with their status. On-time share uses the recorded display rate with a 5% interval tolerance, is omitted for uncapped rows and does not establish a display tier. The methods measure different events and are not ranked against one another. Only released builds are shown. The spreadsheet's README tab describes each column.
Timing by platform
- Mac (M4 Mac mini, M6 Mac mini; frame cap on and uncapped): Metal's per-frame timing:
metalperftraceon-glass drawable intervals for the app's process. Ports: VISR, OpenCE-macOS, CoreCE, Halo OG. - Mac (M4 Mac mini, M6 Mac mini; uncapped, vsync off): The OpenGL frame swap, timestamped by a shim in the app's process (
flushBuffer/CGLFlushDrawable), for a port thatmetalperftracedoes not see. GPU time per frame is not available for these ports (OpenGL). Ports: Chupathingy. - Mac (M4 Mac mini, M6 Mac mini; uncapped, vsync off): Instruments Metal System Trace recorded over the network; each frame's time is a row of the
displayed-surfaces-intervaltable. Against VISR's own frame log over the same window, average rate and p95/p99 agree within 1%. Ports: OpenH1. - Mac (M4 Mac mini, M6 Mac mini; uncapped, vsync off): Another method, named in the
methodcolumn. Ports: OpenH1. - iPhone/iPad (A10X iPad Pro, A14 iPad Air, A14 iPhone 12 Pro, A18 Pro iPhone 16 Pro, A19 Pro iPhone 17 Pro, M1 iPad Pro; frame cap on): Instruments Metal System Trace recorded over the network; each frame's time is a row of the
displayed-surfaces-intervaltable. Against VISR's own frame log over the same window, average rate and p95/p99 agree within 1%. Ports: VISR, Beeman, ChupathingyCE iOS. - iPhone/iPad (A10X iPad Pro, A14 iPad Air, A14 iPhone 12 Pro, A18 Pro iPhone 16 Pro, A19 Pro iPhone 17 Pro, M1 iPad Pro; frame cap on): The phone's on-device Metal performance trace, read with
metalperftrace: each frame's presented interval and GPU time, used where Instruments Metal System Trace cannot record a full window. Against Instruments Metal System Trace on an iPad Pro, average rate agreed within 0.01 fps and GPU p90 within 2%. Ports: VISR, Beeman, HaloPad. - iPhone/iPad (A10X iPad Pro, A14 iPad Air, A14 iPhone 12 Pro, A18 Pro iPhone 16 Pro, A19 Pro iPhone 17 Pro, M1 iPad Pro; frame cap on): The app's own benchmark report: VISR's report, or the telemetry of a port that has no timing tool, counted over the same warm-up and sampling window. Ports: 117-vision.
- iPhone/iPad (A10X iPad Pro, A14 iPad Air, A14 iPhone 12 Pro, A18 Pro iPhone 16 Pro, A19 Pro iPhone 17 Pro, M1 iPad Pro; frame cap on): Another method, named in the
methodcolumn. Ports: ChupathingyCE iOS, Beeman. - Apple TV (Apple TV 4K, Apple TV HD; frame cap on): Instruments Metal System Trace recorded over the network; each frame's time is a row of the
displayed-surfaces-intervaltable. Against VISR's own frame log over the same window, average rate and p95/p99 agree within 1%. Ports: VISR. - Apple TV (Apple TV 4K, Apple TV HD; frame cap on): Another method, named in the
methodcolumn. Ports: VISR, Beeman. - Vision Pro (Apple Vision Pro, M2 Vision Pro; frame cap on): The app's own benchmark report: VISR's report, or the telemetry of a port that has no timing tool, counted over the same warm-up and sampling window. Ports: master-chef, VISR, 117-vision.
- Vision Pro (Apple Vision Pro, M2 Vision Pro; frame cap on): Another method, named in the
methodcolumn. Ports: VISR.
master-chef runs at a fixed 30 fps as shipped, below the 90 Hz display, so it has no uncapped rows.
iPhone/iPad, Apple TV, and Vision Pro charts use runs presented at the device's display rate or, where its profile sets a lower frame cap, at that cap, not an uncapped mode. Their on-time share (frames within 5% of the display interval) is in the spreadsheet, and a device that holds its display rate shows an average near that rate. The Mac chart uses the uncapped, matched-stock runs described below.
Where a build reports GPU or CPU time, a device section opens on the Frame Time view, the cost of a frame: median and 90th-percentile GPU time per rendered frame and median main-thread CPU time per frame, in milliseconds, on an axis that ends at the frame budget (1000 divided by the display rate or frame cap). Lower is better: less time per frame leaves more headroom before frames are missed and draws less power, which lengthens battery life and delays thermal throttling. GPU time on pipelined Metal can include time spent waiting for a drawable, so read it as a cost indicator. The FPS view shows frame rate and 1% low, since a missed frame still counts. A build that reports no GPU or CPU time is listed as not reported; a device section with no frame-cost data leads with frame rate and 1% low.
Halo OG's frame rate is limited by its CPU command submission, not by a frame cap: its uncapped settings are in force (the frame limit is 0 and vsync is off), its GPU is about half idle, and its rate does not change with the drawable size. It lacks several settings the other ports expose, among them shadow size, model LOD and field of view; its rows use its defaults.
Uncapped charts
Uncapped charts show average fps and GPU time per rendered frame, not 1% low rates. When a game renders faster than the display refreshes, macOS hands drawables to the window server in bursts, so the on-glass intervals record when the window server latches drawables rather than the frames a player sees; VISR's intervals alternate between about 0 ms and about 5 ms. Percentiles of those intervals, the 1% low included, describe that latching. The average counts frames shown per second and is not affected. GPU time per rendered frame comes from the same Metal trace. A game that renders several frames for each frame it shows has all of their GPU time added to the next shown frame, so each shown interval's GPU time is split by its command buffers, one per rendered frame, and reported as the median and the 90th percentile over rendered frames. Capped and device charts keep the 1% low and add the share of frames that arrive on time. The spreadsheet keeps every column.
Suites
- Campaign: the openings of c10 (343 Guilty Spark) and b30 (The Silent Cartographer). One player, no input, default enemies. Each window warms up for 15 seconds after player readiness, takes a five-second background CPU baseline, then samples for 60 seconds. Three rounds per set. A set with fewer than three valid rounds is marked incomplete. Earlier sets used the a10 opening and a b30 window 90 seconds later (
b30 +90 s); those rows stay in the spreadsheet. Measured on 11 ports: VISR, OpenCE-macOS, CoreCE, master-chef, Beeman, ChupathingyCE iOS, Chupathingy, Halo OG, 117-vision, HaloPad, OpenH1. - Combat: the player is made deathless and placed in a battle from the game console: the a50 hangar (
switch_bsp,object_teleport,ai_placefor the Covenant floors and the Marines,ai_magically_see_encounterandai_magically_see_playersso the sides engage at once) and Exterior A of b40 (the same commands), each sampled for 60 seconds after a 15-second warm-up, plus the b30 bot window: the scripted bot player for 1,800 game ticks (60 seconds of game time) from tick 900. Battles and the bot window are equivalent workloads, not replays: the AI's outcome differs by a few actors between runs, so each round's end counts (ai_living_count, player health, ticks) are kept in thefingerprintcolumn and a round outside the other rounds' range is flagged innotes. A round is rejected when an encounter was not placed, the game reloaded a checkpoint, or the bot did not cover its ticks or throw a grenade. A port with no unattended console shows the statusnot_measured. Measured on 9 ports: VISR, OpenCE-macOS, CoreCE, Chupathingy, Halo OG, Beeman, HaloPad, ChupathingyCE iOS, OpenH1. - Cutscenes: two whole in-engine cutscenes called from the console,
x70_bridgeon d40 andcutscene_rescueon a50, sampled from the call to the script'sprint. Their length is set by the game's ticks, so it is the same on every port. A round is rejected when the print does not arrive within 1.5 times the expected length or the sample covers less than 95% of it. Measured on 9 ports: VISR, OpenCE-macOS, CoreCE, Chupathingy, Halo OG, HaloPad, ChupathingyCE iOS, Beeman, OpenH1. - Multiplayer: a hosted Slayer match on Chill Out and one on Blood Gulch, each a sampling window; the suite value is the mean over both maps' windows. One local player, driven by the scripted bot input, hosts and starts the match with no other humans. Bot input is paced from the wall clock, so runs on different ports, and repeated runs on one port, play equivalent workloads, not identical replays. Measured on 5 ports: VISR, OpenCE-macOS, CoreCE, Chupathingy, OpenH1.
- Split-screen co-op: local split-screen campaign co-op on one device, two players. Enemy scaling is set explicitly to static 1x on every port that has the option: VISR sets
debug.enemy_multiplier = 1, and OpenCE-macOS and CoreCE set their enemies-per-player scaling to static 1x. A port without the option runs its own fixed behavior, and its notes column in the spreadsheet says so. A port without split screen shows "Does not support split screen" and the statusnot_supported; that differs from "not measured", which means the suite has not been run for the build. Measured on 1 port: VISR. - Overall: per build, the geometric mean of the suites' average rates and the geometric mean of their 1% low rates, each suite weighted equally, so every suite counts the same whatever its frame-rate scale. Each chart averages the suites that every build drawn in it has measured, so its bars stay comparable; the caption names them. A build that shares fewer than two suites with the others is left out and named in the caption. Ticking or unticking a build can change which suites a chart covers.
Mac charts use a 2560×1920 drawable (a 1280×960-point window at 2×), where the ports' frame times separate; 1280×960 rows stay in the spreadsheet. Device sets run the same windows through a hosted one-player game, with the console commands held until the level runs. Their cpu_p50_ms column is VISR's own median frame CPU time, which shows the work a window adds on a device where the CPU matters.
A round is rejected when the outside-process CPU average rises more than half a core above the baseline taken before the window. Each round allows three attempts. Rejected attempts appear in the spreadsheet with the status rejected and their reason. This snapshot has 0 rejected attempts.
Suite definitions and the harness are in tools/perf_compare (adapters.py, refresh.py).
Background CPU is sampled for five seconds immediately before each native sampling window. Runs are rejected when average outside-process CPU rises more than half a core above that baseline. Steady background work remains active and may affect these estimates. Each round allows up to three attempts; rejected attempts do not enter the ranges.
Opening runs use a10 and b30 with no input: 15 seconds of warm-up after player readiness, a five-second background CPU baseline, then 60 seconds of sampling. Opening cinematics are included. Native apps use 1280×960 drawables on a 60 Hz display with interpolation. Capped rows request a 60 fps cap and keep each app's other graphics defaults. These runs do not establish combat performance or identical image quality. Player readiness does not align cinematic clocks, so opening sequences can have phase offsets between apps.
Uncapped runs request display.frame_rate = "unlimited" in VISR, display.max_fps = -1 in OpenCE-macOS, and display.frame_limit = 0 in CoreCE, with display.vsync = false and interpolation enabled in each. The frame_mode and delay_s columns of the spreadsheet identify each mode and extra delay after warm-up (0 s is the opening window). The 60 Hz display still limits visible refreshes; presentation intervals do not establish simulation speed or unique displayed frames. Above-refresh trace rates have unverified physical meaning and are not verified submission throughput. The same elapsed window does not prove identical gameplay. Each launch uses fresh isolated data/save folders; OS and driver caches are not reset or equalized.
The matched-stock preset disables antialiasing, replacement HUD/text, and first-person legs in each native app, and each uses direct camera and 128-pixel shadow maps. VISR also uses automatic model LOD, the Xbox-size effect buffer, 1× anisotropic filtering, no replacement textures, and no first-person body. OpenCE-macOS uses native resolution scaling, stock world/weapon FOV, and disables optional per-pixel lighting, weapon shields, and shield glow. CoreCE uses the same options as OpenCE-macOS and model_detail = "stock". Other defaults remain unchanged. VISR uses native Metal and compressed GPU textures; OpenCE-macOS uses ANGLE over Metal. These runs could not verify the other ports' internal filtering, LOD, effect-buffer, or texture-storage policy, so identical image quality remains unverified. Weapon framing and texture filtering still differ visibly. Capped rows keep each app's graphics defaults and are not quality-matched to the matched-stock rows.
Configuration references: VISR settings, OpenCE-macOS v1.0.2 settings, CoreCE graphics settings.
The later b30 window adds 90 seconds after warm-up, reaching the beach encounter at about 110 seconds after player readiness once the CPU baseline is included. It samples 60 seconds with a stationary player and no input. Start/end screenshots qualify the camera location, but AI and combat state can vary between apps and rounds; this is not a deterministic combat replay.
CoreCE rows come from separate matrices run after the VISR and OpenCE-macOS matrices on the same hosts and dates, so they do not share round rotation with them. CoreCE reads the same maps from a copied folder, because its Mac host does not accept a linked maps folder.
Apple's metalperftrace records per-frame on-glass drawable intervals. CPU/GPU durations and aggregate FPS are excluded. Repeated image content is not detected.
A shim in the app's process timestamps each OpenGL frame swap (flushBuffer / CGLFlushDrawable) for ports that metalperftrace does not see. On two Metal ports its average rate matched metalperftrace to the digit. It reports no GPU time per frame.
Instruments Metal System Trace records the displayed-surfaces-interval table over the network: the time each frame is swapped onto the display. Repeated image content is not detected.
The on-device Metal performance trace records each presented frame's interval and GPU time, read with metalperftrace. It is used where Instruments Metal System Trace cannot record a full window. Against Instruments Metal System Trace on an iPad Pro, average rate agreed within 0.01 fps and GPU p90 within 2%. Repeated image content is not detected.
The app's own benchmark report counts the frames it presents; its intervals are the app's, not the display's.
These records use another method; their relationship to displayed pacing is unverified.